As we have learned in our previous chapters about regression & Simple Linear Regression, if you did not go through it, please do it is recommended. So in this chapter, we will discuss about Multiple Linear Regression. It’s concept is same like simple linear regression like we predict a continuous value through our model but there are some key difference’s which you might know.
What is Multiple Linear Regression
Multiple Linear Regression is a statistical method used to model the relationship between multiple independent variables which are our (features) and a dependent variable (target)which we want to predict assuming a linear relationship. The goal is to find the best-fitting linear equation that explains the variation in the target variable based on the given features. NOTE: It is same like Simple Linear Regression we find best fitting linear equation which also explain variation between our dependent variable and independent variable but keep the difference in mind that there is only one independent variable like we can say our features and here in multiple regression there can be more than one independent variable.
Purpose of Multiple Linear Regression
The aim or you can say purpose of using multiple linear regression is to evaluate the relationship between multiple independent variables (our features)and a dependent variable(our target value). It helps us understand how the dependent variable changes as the independent variables change. Mean we are trying to see variance between these variables.
Interpreting the Line
In multiple linear regression, the line represents the best-fit relationship between the independent variables and the dependent variable. It means that the coefficients of the line indicate the impact of each independent variable on the dependent variable, holding other variables constant. For example if we have data of CO2 Emission of car which is our target value or you can say dependent variable and others features such as engine size , no of cylinders are our independent variable so our target variable i.e CO2 Emission is depend on both engine size & no of cylinders. Don’t worry we also see implementation of this example in Python.
How to Calculate Coefficients in Multiple Linear Regression
The coefficients in multiple linear regression represent the change in the dependent variable for a unit change in the corresponding independent variable, while keeping other variables constant. They are calculated using methods like the Least Squares approach etc.

How to Minimize Errors in Multiple Linear Regression
In Multiple linear regression, we minimize the difference or you can say error between the actual values and the predicted values (residuals/errors). The goal is to find the line that minimizes the sum of squared errors to best fit the data we can do this by using sklearn library of Python.
Optimizing the Line in Multiple Linear Regression
The optimization process in linear regression involves adjusting the coefficients of the line to minimize the error mean our target is to make our model to that level so it predicts accurate values. This is usually done using optimization algorithms like Gradient Descent etc.
How to find co-efficient in Multiple Linear Regression mathematically
The mathematical approach to calculate coefficients involves many techniques like using linear algebra. The coefficients can be found using techniques like matrix multiplication and inversion etc.
How to use Coefficients for Prediction in Multiple Linear Regression
Once the coefficients are determined, they can be used to predict the dependent variable(our target value) for new data points. The general formula for prediction is: y = b0 + b1x1 + b2x2 + … + bn*xn, where b0 is the intercept and b1, b2, …, bn are the coefficients.
How to do Multiple Linear Regression in Python
Here’s a step-by-step implementation of Multiple linear regression in Python using the numpy library for calculations and sklearn for linear regression & matplotlib for visualization of data.
import numpy as np
import matplotlib.pyplot as plt
from sklearn.linear_model import LinearRegression

# Generate random data
np.random.seed(0)
n_samples = 50
X1 = np.random.rand(n_samples) * 10
X2 = np.random.rand(n_samples) * 5
noise = np.random.randn(n_samples) * 3
y = 2 * X1 + 3 * X2 + 5 + noise

# Create feature matrix X with two columns (X1 and X2)
X = np.column_stack((X1, X2))

# Create a linear regression model
model = LinearRegression()

# Fit the model
model.fit(X, y)

# Coefficients and intercept
coef_1, coef_2 = model.coef_
intercept = model.intercept_

# Generate predicted values
predicted = model.predict(X)

# Plotting the data points and the regression line
plt.scatter(X[:, 0], y, color='blue', label='Data Points')
plt.scatter(X[:, 0], predicted, color='red', label='Predicted Values')
plt.xlabel('X1')
plt.ylabel('y')
plt.title('Multiple Linear Regression')
plt.legend()

# Plotting the regression line
x_range = np.linspace(min(X[:, 0]), max(X[:, 0]), 100)
y_range = intercept + coef_1 * x_range
plt.plot(x_range, y_range, color='green', label='Regression Line')

# Display coefficients and intercept
print(f'Coefficient 1: {coef_1:.2f}')
print(f'Coefficient 2: {coef_2:.2f}')
print(f'Intercept: {intercept:.2f}')

plt.legend()
plt.show()
Output
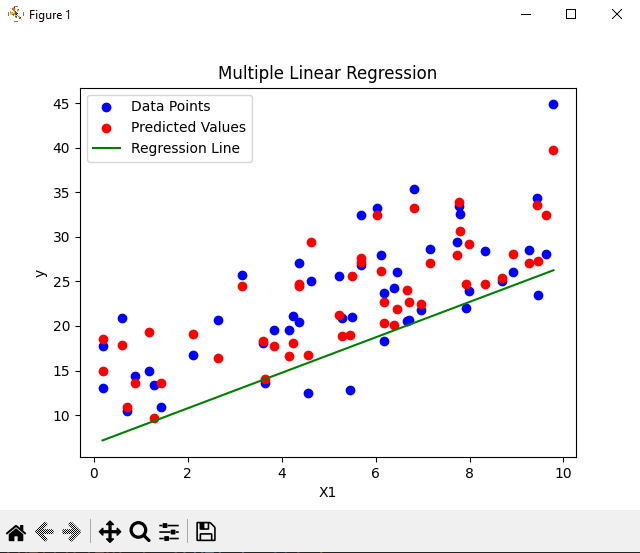
Coefficient 1: 1.99
Coefficient 2: 2.77
Intercept: 6.79

Conclusion
In last by concluding all above i want to say that, Multiple linear regression is a powerful tool for modeling and predicting relationships between variables. It helps us understand how different factors influence the outcome and enables us to make predictions based on these relationships.
Link: https://Codelikechamp.com
Medium Link: Follow me on Medium
Linkedin Link: Follow me on Linkedin